This post is about how and why need to configure the log analytics for our Microsoft Intune portal. The main reason is that the MDM enrolled devices at your organization need to closely monitor and analyse the data that in the Intune tenant. This post will illustrate how to configure diagnostic settings in Intune in order to send data to a Log Analytics workspace.
Step 1- Login in to your Azure Porta using your Global Admin account and Select Intune > Click Reports > click Log Analytics

Step 2- On the Create Storage menu, Select the Subscription > Create a New Resource Group(Separate for Intune only) > Type the Storage Account Name > Select Location, Account type and Replication and Click Next

Step 3- Since I am using a testing tenant, I have selected the “Public Endpoint (All Networking)” . However, if you want you cans select the other option which is “Public Endpoints) and select your defined networks. Once done Click Next.

Step 4- On the Advanced settings, leave the settings as it is and Click Next to continue or otherwise, you can change the settings the way your require.

Step 5- On the Tags menu, you can either create tag or skip and continue. It will be pretty much easy for you if you create a tag for this storage because it will be easy for you to categorize resources separately specially on the billing consolidation. Click Next.

Step 6- Once the verification is accepted, Click Create to start the storage creation process for log analytics.
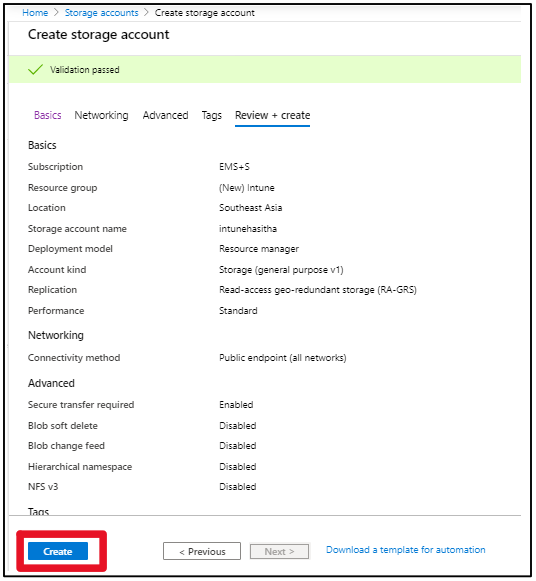
Step 7- You can verify the successful storage creation as follows.

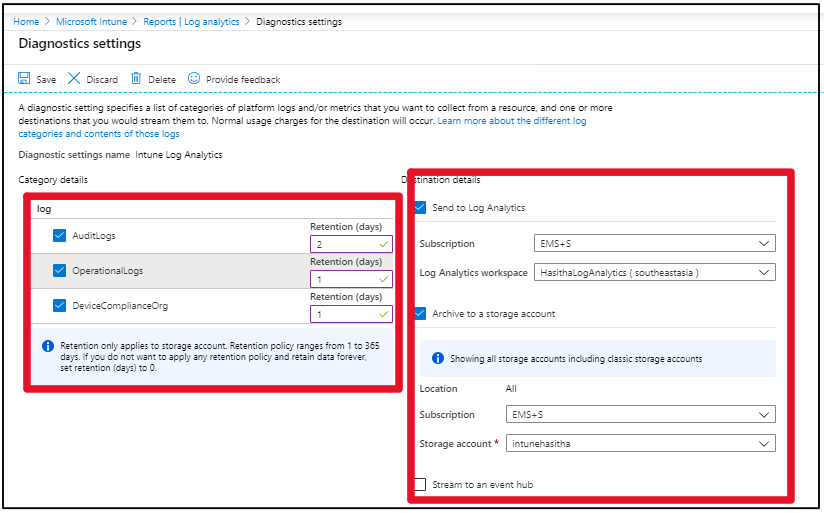
Step 8- On the Intune Portal Go to Reports > Diagnostic Settings, configure the way how you need to analyse your logs and its retention periods. As follows.
Finally on the workbooks menu in reports section you can do the Untune Audit Activities as follows. Enjoy the Intune Log Analytics for better MDM management portal. Cheers.
